FX Graph
6.002.3
Software information
License:
Time-limited trial (Free to try)
Updated:
30 Jun 2016
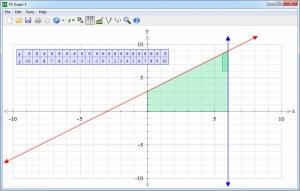
Software Screenshots
Size: 25.5 GB
Downloads: 10315
Platform: Windows (All Versions)

Drawing graphs is the best way to represent a mathematical equation or something similar. It makes them easier to understand and it can spare you from further calculations. If you find it difficult to draw a graph on a piece of paper, you can install FX Graph on your computer and draw it like a professional. The application's functions are not complicated and you can use them to represent mostly any calculations.
FX Graph comes in two editions, for Windows and Mac OS X. You can install it in a few moments, after downloading its small setup file. Besides installing the program's components, the setup wizard will also integrate FX Graph with MS Word.
Thanks to FX Graph's smart functionality, you will not have to draw the graph yourself. By default, the interface presents a blank graph with X and Y axes. Any values you provide for X or Y will appear on the graph automatically. You just need to access the graph's Properties, by selecting a toolbar option or by simply right clicking anywhere on the graph.
The Properties window is divided into separate sections. They contain numerous options, for changing the graph's visual style, setting up maximum and minimum values for both axes, inserting values and deciding how they should look. You can insert any number of values, for both axes, in the same text box.
A value can be anything, from a simple number to a complex mathematical expression. After inserting a value, you can add a new one on the next line, in the same text box. You may represent them as lines or dots and color them differently, which is optional. When you go to the next line, to add a new value, the software will assign a different color to your value automatically.
If you hover with the mouse cursor over a line, its value will appear as an annotation. Right clicking a line will reveal a series of options for making annotations permanent, activating domain marks, asymptotes and more. You can also use the options on the toolbar to mark any coordinates with a dot, highlight areas and switch between other modes. The graph can be saved in the program's native format or in different image formats. Alternatively, you may insert it in a MS Word document, PowerPoint presentation or connect it with other files.
Pros
You just need to insert values for the X and Y axes and the software will draw the graph for you. It lets you add annotations, tables, mark areas and more. It is possible to customize mostly anything, including the graph, the background or the way your values are displayed.
Cons
There are no options for inserting the graph into an Excel spreadsheet. Thanks to FX Graph, you don't need any drawing skills to represent a mathematical expression. The user friendly interface makes this application accessible to everyone, from secondary students to college students.
FX Graph
6.002.3
Download
FX Graph Awards

FX Graph Editor’s Review Rating
FX Graph has been reviewed by Frederick Barton on 01 Oct 2012. Based on the user interface, features and complexity, Findmysoft has rated FX Graph 5 out of 5 stars, naming it Essential